

10 - 6 - 0 ---8th Ranked
207.63 Yds/Game ---12th Ranked
169.75 Yds/Game ---3rd Ranked
I’m partial to the Kingston Trio’s rendition of the popular song Where Have All the Flowers Gone? After last night’s double-header between, myself, coach cheapcatch, and jordanshrug, a new tune in the form of a question arose: Where has all the offense gone? The coaches embarked on an hour long crap fest that ended only when Ken Stabler picked himself off the ground on the final play of the game, after slipping for the umpteenth time. Finally it was over!
In game one as Chicago, now (5-6), faced Tampa Bay, now (5-5-1), a lack of offense was to be expected, as the #2 and #4 ranked defenses went at it, but that doesn’t mean the play is any less ugly when couched in those terms. In all the Bucs mustered 59 yards of total offense, and after Doug Williams was benched for throwing two costly INTs, Mike Rae came in relief, going 0/6 with a pick. The best punt of the day came when Rae chucked a long ball on 4th and long that was intercepted in the end zone.
Meanwhile, Chicago was again without “superstar” Walter Payton, and once again, that did not seem to matter, as the Bears have reeled off four straight wins, all without Payton, after beginning the season (1-6) with Payton in the lineup. One of Payton’s lowly reserves, I guess, thought he was Walter Payton as he spun quite a bit, gaining 55 yards on 9 carries. A few more games like that, and he’ll catch Walter Payton and his impressive 353 yards rushing on the season.
Back to the game: Nearing halftime the game was tied 0-0, until Mike Phipps dropped back-waaaayyyy back- heaving a 69 yard touchdown to James Scott, for his only catch of the game. The Bears failed to score in the third quarter after Terry Schmidt hauled in his seventh INT of the season, returning the ball inside the Buc 10 yard line (the result was a missed FG). The score remained 7-0 after three quarters.
Leeroy Selmon was the shining star for the Bucs, as he broke through almost every play, even though he only ended with 2 tackles and 1 sack. Meanwhile the Bears defensive line completely overwhelmed the Bucs feeble OLine, as they gained 4 total sacks and were constantly in the backfield.
The Bears would strike again in the 4th quarter, inspired by a Phipps 40 yard floater to Rickey Watts. Eventually Robin Earl in rare duty and a rare feat, evaded a Buc defender, then leaping his way into the end zone for the touchdown. This would give us the final score of 14-0. Coach Shrug brought forth the “Ewing Theory”, which attempts to capture a how a team gets better once a star player goes out of the lineup. Is the “Ewing Theory” appropriate for the Bears and Walter Payton? Another, probably-not-much-of-a-coincidence is the fact that the Bears started winning once Vince “Bob” Evans stopped entering the game. Pick your theory, or add your own to the mix….
The Bears now hold a (5-2) divisional record, after completing the season sweep over division leading Tampa Bay, and are just a half game back of the division lead. So there we have it: Game 1 of the double-header not doing much to inspire the kids to become future offensive stars, with the Bucs not doing much of anything and the Bears resorting to a scatter of cheapness.

Game 2 featured an AFC rivalry between the Chiefs and the Raiders. Oakland manhandled KC the first go-around 28-13, matching up quite well with the Chiefs, despite Kansas City’s pretty surprising superior, division leading record. Wellll….in this one Oakland straight up laid a stink bomb on offense and special teams. Each team at least played pretty good defense, giving up 13 points of the total 27 points scored.
The first thing one needs to know is this was a rain game. Things were amiss for the Raiders, almost from the get-go. Stabler (Due to the rain? Himself?) just did not want to throw the ball on time, and this really put a kink into things. It made me wonder if it was the rain, or Stabler himself, as I had no problem delivering the ball on time with Phipps just moments ago. Anyhow, with the game again deadlocked nearing halftime, just like the former game, Stabler lured The Taxman to a certain wide out, and then switched quickly to an open WR in the middle. “One press of the B Button ah ah ah….Two presses of the B Button ah ah ah….Three presses of the B Button ah ah ah….Four presses of the B Button. There we go: Four, four presses.” But no! Don’t throw it now, Barbaro has had time to recover! Too late: With the B button glitch in full effect Gary Barbaro trots over to pick off Stabler’s late pass (actually he had plenty of time….), and then due to the rain, everyone is slow as slugs, giving the Taxman ample opportunity to jog 65 yards for the first score of the game. It was 7-0 Chiefs at the half.
B Button glitch or no B Button glitch Stabler was pretty crappy in this game, completing 4/16 throws while notching two picks. The second of which stalled a nice Oakland drive, after Stabler went for the gusto with Dave Casper and was INT’d by M.L. Harris in the end zone. When coach Cheapcatch took over the Raiders, they were (0-2), but after reeling off five straight wins, and with the offense on absolute fire, Cheapcatch was feeling pretty confident about what he had in Oakland. But now the Raiders have dropped three of four games, scoring no more than 14 points in any of those games. Stabler only has 2 TDs to 5 INTs during that span, after throwing 16 TDs to 1 INT to start the season.
Although Oakland already had two turnovers at this point, the fateful turning point of the game might have occurred following the Raider defense backing the Chiefs up deep in their own end. With the Raiders trailing just 7-0, Dave Casper received the punt, making it down to about the 30 yard line, setting up the Raiders with excellent field position. Except….for the fact that he fumbles the ball, with the Chiefs recovering, and taking it to midfield. This would lead to a 60 yard FG, giving the Chiefs a commanding (not an exaggeration) 10-0 lead. Oakland would respond midway through the fourth quarter, kicking a FG of their own, now down 10-3. Immediately the Raiders went for the onside kick. There were no Chiefs to be found, while four Raiders in a frenzy swarmed around the ball. For several seconds the Raiders hovered about the ball….pick it up! Pick it up! No one would do so for some reason. After about five seconds a Chief came out of nowhere to scoop up the ball, taking it the distance, and sealing the game at 17-3.
The Chiefs would add a late touchdown to make the game 24-3 when the deadly Mike Living “La Vida” Ston to JT Smith combo beat the one true Jedi in the end zone. The Chiefs only compiled 80 yards of offense, but they scored 21 more points than the Raiders. This game seemed to exemplify the Chiefs surprising (8-2-1) record. With no offense to speak of game in and game out, the Chiefs under coach Shrug keep winning. The formula here, as with many of their other games, is a stout, opportunistic defense, and just all around timely plays. For the Raiders the game was an embarrassment. The defense played really well, although no one could tell from the score. With a great chance to hop up the playoff ladder, and even make a run at the AFC West, the Raiders fell flat in the mud of the rain soaked field. Ken Stabler slipped so many times there was thought someone was dropping Mario Kart bananas in his path. At (6-5), and after losing three of four, the Raiders playoff chances are dimming. Meanwhile the Chiefs are sitting pretty comfortable at the top of the AFC West, and even if San Diego does manage to catch them, they seem assured a playoff spot.
The double-header was split a game apiece, but that is not the only thing these coaches shared that night: They both wondered Where has all the offense gone?
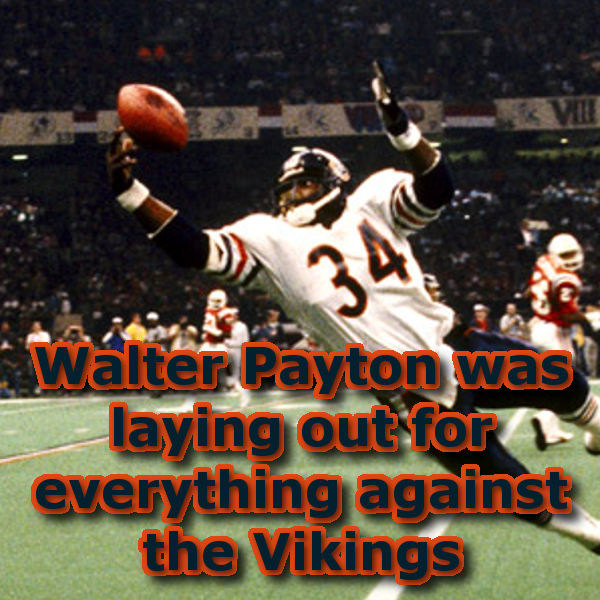
It's 1982 already, and this is the first time I've had the chance to write one of these Player of the Week articles about Walter Payton. Despite his being the TLL's leading all-time rusher, it's just his second time winning the award, with his first coming in Week 11 of 1980. And this time, thanks to his 56 RECEPTIONS attribute, he's won the Offensive Player of the Week award for his pass catching rather than his rushing. Against the division-rival Vikings, he gathered in all 245 of the Bears' aerial yards on five catches, four of them for touchdowns, and he carried the ball twice for 34 yards and another touchdown. Chicago won the important division clash in a shootout, 45-35. Payton set the league record for receiving yards by a running back in a single game, and was the 10th-highest for any player not named Largent.
There aren't too many stories I could write about Payton that haven't already been well-documented elsewhere. But one of the most impressive stories is told simply by looking at his page on pro-football-reference.com. It's what I've always thought to be a remarkable career:
During the eleven seasons from 1976 through 1986, Payton rushed for over 1,000 yards ten times (with a minimum of 1,222), missing the mark only in the strike-shortened 1982 season. Even during that year, Payton was on pace to go over 1,000, so we can give it to him. That's more than a decade of dominance, putting him in an extremely elite class of running backs. It makes me wonder: what claim does Walter Payton have to being the greatest of all NFL rushers?
So here we go. Matt's about to go all stats-crazy once again. But before I do, let me start with a couple of notes. First, a caveat: if we had some of the newer stats-keeping available across all or most of NFL history, it might be close to possible to answer this question . But although rushing yardage has been recorded since 1932, it only records carries, yards, and touchdowns. There is no record of the game situations in which those yards happened. So, in the absence of situational stats, we'll have to deal only with the compilation of rushing yards.
Second, to be considered the best of all-time, you have to have been the best of your time. And by that, I don't mean for just a year or two; "greatness" in the definition I'm using here, requires both productivity and longevity. So, sorry Terrell Davis and Priest Holmes: you're not in this conversation. So, somewhat arbitrarily, let's look at 10-year periods. To qualify, you had to have led the league in rushing over a 10-year period. I compiled a list of those players for every 10-year period since rushing records have been kept. I also translated those yards to a 16-game season to account for differing season lengths and injury, so that rushing statistics look more like those that we see in today's NFL. I kept a running career 16-game average of the period that the player led the league to create a smoother trajectory of the player's career productivity.
This list by itself doesn't tell us a whole lot, other than telling us whose careers deserve further investigation. For example, it's clear that both Joe Perry and Eric Dickerson were each premier backs of their day, since Perry was the league's leading rusher over eight consecutive 10-year spans and Dickerson for six. But, over his career, Perry's average yards per season (adjusted to a 16-game average) hovered between 1,007 and 1,040 yards, while Dickerson started out at 1,710 and, although his average decreased over time, it never dipped below 1,522. Does that mean that Eric Dickerson was a lot better than Joe Perry?
I don't think it does. The real question of greatness is how a player performed against his peers, how dominant he was in his time.
Let's look at the players whose periods of ascendency were significantly long to be considered dominant: say, four or more consecutive decade-long stretches of leading the league in rushing. That gives us Steve Van Buren (7), Joe Perry (8), Jim Brown (9), Leroy Kelly (4), O.J. Simpson (6), Payton (7), Eric Dickerson (6), Barry Sanders (4), and LaDainian Tomlinson (4). That leaves off Tuffy Leemans, about whom I know next to nothing, but it also leaves out Curtis Martin, about whom I know a lot and am very comfortable saying he has no business in the conversation of the greatest running back of all time. I'll assume that Leemans and others whose period of leadership was three seasons or fewer are in the same boat as Martin. Four seasons also gets Barry Sanders into the comparison, which I think is pretty important.
To compare those guys across eras, I looked at their career rushing totals in comparision to their contemporaries. Specifically, I compared the rushing totals for each season of their careers to the league leader in rushing for that season and the 2nd-place rusher. I then expressed that number as a percentage of each. For example, Leroy Kelly was the leading rusher for 1967, so he gets 100% of the leading rusher total for that season. His 1205 yards were 123.97% of the 2nd-highest total that year (Dave Osborn, 972 yards). In 1969, Kelly finished 5th in rushing (817 yards); he gets 86.73% of 2nd place (Calvin Hill, 942) and 79.17% of the lead (Gayle Sayers, 1,032).
That gives a good year-by-year number that allows us to compare players of different generations with different rushing practices. I then added the % of 2nd place and % of lead and calculated a running career average from year to year. On a graph, that line should give us a good visualization of each back's career trajectory.
Below are the charts for each player. The blue line represents each player's % of the 2nd-place rushing total for each season, and the red line represents his % of the rushing leader's total. The pink line represents the player's cumulative career average % of 2nd + % of lead - think of it as evaluating that player's total career if it ended in that year. Finally, I've charted each player's career max season and career median season as a flat line across the player's career. The charts are in chronological order:
One thing that I think is crystal clear from this: Jim Brown was a badass. You look at his rushing totals, and they look pretty good in comparison to today's numbers. In 2015, Adrian Peterson led the NFL in rushing with 1,485 yards, which Brown surpassed three times in a nine-year career. That's especially impressive when you consider that two of those seasons were during the shorter 14-game NFL season that began in 1961 (1,863 yards in 1963 and 1,544 in his final season of 1965), and even more so when you see that the first time he did it was in the 12-game NFL season of 1958. In a 16-game season, his 1,527 yards that year would translate to 2,036. Pretty impressive.
But you've seen 2,000-yard rushers in your lifetime. Nobody had seen anything close to what Brown was doing during those years. There had only been seven 1,000-yard rushing seasons in NFL history when Brown first did it in 1958, and he would go on to equal that number himself. And he would do it in a big way - Steve Van Buren's 1,146 yards in 1949 was the single-season rushing record when Brown entered the league, and Brown would top that number seven times. By the time he retired, Brown possessed the top three and seven of the top nine rushing seasons of all time.
I knew that Brown won the rushing title in eight of his nine seasons before doing this study, but what I did not know, and what these charts reveal is by just how much he was blowing his competitors away. Brown's career median of 228.28 means that on average he was winning the rushing title by 28%. That's an average. By comparison, the next-highest median on the list was Barry Sanders, whose career median of 199.18 meant that in an average season, he was losing the rushing title by .82%. In his 1,527-yard 1958 season I mentioned above, second place went to Alan Ameche, who rushed for 791 yards. In other words, Brown ran for 93.05% more yards than his nearest competitor. Three of his rushing titles were by 78% or more, and two more were by 25% or more. Of those charted, only one captured a rushing title with more than 75% more yards than his nearest competitor: O.J. Simpson, in his 14-game, 2,003-yard 1973 season, ran for 75.09% more yards than runner-up John Brockington (1,144 yards). Brown's dominance was unflagging and it is unquestionable:
Jim Brown is the greatest rusher in the history of pro football.
Sorry, Walter.
If we're looking to quantify greatest rushers, I think the career medians are a pretty good way to do it. So here are those, in order, along with the %s from each player's most dominant season:
1. Jim Brown: 228.28 (293.05)
2. Barry Sanders: 199.18 (221.88)
3. Steve Van Buren: 194.52 (250.45)
4. Eric Dickerson: 188.58 (225.00)
5. Walter Payton: 175.49 (245.48)
6. LaDainian Tomlinson: 157.38 (209.92)
7. O.J. Simpson: 154.71 (275.09)
8. Emmitt Smith: 149.48 (218.20)
9. Leroy Kelly: 143.07 (228.13)
10. Joe Perry: 126.98 (254.04)
So, sorry Walter - you don't have a claim to the greatest rusher of all time. Jim Brown's got everyone beat by a mile, and Barry Sanders, Steve Van Buren, and Eric Dickerson have got you beat.
However, no one has ever been more consistently productive over a long time than Payton. Excluding his rookie and retirement seasons, he was within 75% of a rushing title in nine out of 10 seasons, and nobody on this list produced that level of consistency.
Just for giggles, here's Adrian Peterson's career so far on the same scale as the other backs:
Peterson's 2012 season, when he ran for 2,097, was the most dominant we've seen on this list since Payton's 1977, and his career median 2nd-place-plus-lead-% puts him just behind Payton in 6th on the all-time list.
mb 9.3.2016

Instead of me introducing this week's Defensive Player of the Week, I thought I'd let him just go ahead and do it himself:
I think Fencik is being a little disingenuous when he says that he doesn't know what they mean by calling him "The Hit Man." During his 12-year career, he gained the reputation as being one of the most ferocious and hard-hitting safeties in football, and, after enduring the lean years of the late 70s and early 80s with the Bears, he was already in place to be the perfect free safety for Buddy Ryan's 46 defense. The free safety was even more the quarterback of the 46 than the middle linebacker was, and was required to possess very high levels of intelligence and aggression. Fencik had both in spades.
Since starting the TLL, I've had the feeling that Gary Fencik is one of the players largely underrated by history.. I say that fully aware that it's a very difficult statement to substantiate, since defensive players in general are so difficult to evaluate, especially ones you didn't see in person a lot. It's one thing if you're Pro Football Focus and have teams of researchers analyzing everything every player does on every play. But even if you can afford the $100 a year to have access to such data, it doesn't help figure out how a guy like Gary Fencik compares to, say, Earl Thomas, since there is almost no data for Fencik. We know
A number I rely on a lot when designing the defenses for the TLL rosters is Pro-Football-Reference's Approximate Value. It's far from perfect, but without it, it would be impossible to make TLL rosters for positions like defense and offensive line, where there is simply no statistical data for players back in the era we chose to set the league in. It's kind of the opposite of the way PFF evaluates players. It works by a series of assumptions, starting with the assuming that, for example, defenses that performed better (defined by points allowed per defensive drive) had better players and thus assigns more points to those teams. Then, within individual teams, it assumes that players who were named all-pros were better than players who were not, so it assumes the largest share of the team's defensive points to the all-pros. Similarly, players who were named to the Pro Bowl were better than those who were not (a far less dubious assumption in the 70s than it is now), and gives those Pro-Bowl players the next-largest share of the points. Then, it assumes that players who started were better than those who did not, so it assigns the third-most points to the starters. Anything left over is then assigned to the role players.
Each assumption is a valid one as a general rule, and while it's impossible to claim with any certainty that a particular player who had 12 AV for one season was better than another one who was assigned 10, it is a near-certainty that the group of all 12 AV players was better than that of 10 AV players. Similarly, it's valid to say that players who amassed 100 AV in their careers were better than those who accumulated 50.
So let's look at the list of the top-25 AV earners for players listed as safeties, post-merger (1970-present):
| Games | Def Interceptions | Misc | ||||||||||||||
|---|---|---|---|---|---|---|---|---|---|---|---|---|---|---|---|---|
| Rk | From | To | Draft | Tm | Lg | G | GS | Int | Yds | TD | PD | Yrs | PB | AP1 | AV | |
| 1 | Rod Woodson* | 1987 | 2003 | 1-10 | TOT | NFL | 238 | 229 | 71 | 1483 | 12 | 15 | 17 | 11 | 6 | 192 |
| 2 | Ronnie Lott* | 1981 | 1994 | 1-8 | TOT | NFL | 192 | 189 | 63 | 730 | 5 | 0 | 14 | 10 | 6 | 161 |
| 3 | Charles Woodson | 1998 | 2015 | 1-4 | TOT | NFL | 254 | 251 | 65 | 966 | 11 | 155 | 18 | 9 | 3 | 157 |
| 4 | Ronde Barber | 1997 | 2012 | 3-66 | TAM | NFL | 241 | 232 | 47 | 923 | 8 | 166 | 16 | 5 | 3 | 151 |
| 5 | Brian Dawkins | 1996 | 2011 | 2-61 | TOT | NFL | 224 | 221 | 37 | 513 | 2 | 120 | 16 | 9 | 4 | 140 |
| 6 | Ed Reed | 2002 | 2013 | 1-24 | TOT | NFL | 174 | 169 | 64 | 1590 | 7 | 141 | 12 | 9 | 5 | 136 |
| 7 | Aeneas Williams* | 1991 | 2004 | 3-59 | TOT | NFL | 211 | 207 | 55 | 807 | 9 | 28 | 14 | 8 | 3 | 136 |
| 8 | Eugene Robinson | 1985 | 2000 | TOT | NFL | 250 | 232 | 57 | 762 | 1 | 0 | 16 | 3 | 0 | 126 | |
| 9 | Donnie Shell | 1974 | 1987 | PIT | NFL | 201 | 162 | 51 | 490 | 2 | 0 | 14 | 5 | 3 | 120 | |
| 10 | John Lynch | 1993 | 2007 | 3-82 | TOT | NFL | 224 | 191 | 26 | 204 | 0 | 51 | 15 | 9 | 2 | 118 |
| 11 | Darren Sharper | 1997 | 2010 | 2-60 | TOT | NFL | 205 | 182 | 63 | 1412 | 11 | 101 | 14 | 5 | 2 | 118 |
| 12 | Troy Vincent | 1992 | 2006 | 1-7 | TOT | NFL | 207 | 200 | 47 | 711 | 3 | 47 | 15 | 5 | 1 | 118 |
| 13 | Troy Polamalu | 2003 | 2014 | 1-16 | PIT | NFL | 158 | 142 | 32 | 398 | 3 | 108 | 12 | 8 | 4 | 115 |
| 14 | LeRoy Butler | 1990 | 2001 | 2-48 | GNB | NFL | 181 | 165 | 38 | 533 | 1 | 2 | 12 | 4 | 4 | 111 |
| 15 | Seth Joyner | 1986 | 1998 | 8-208 | TOT | NFL | 195 | 172 | 24 | 307 | 2 | 0 | 13 | 3 | 0 | 108 |
| 16 | Albert Lewis | 1983 | 1998 | 3-61 | TOT | NFL | 225 | 188 | 42 | 403 | 1 | 0 | 16 | 4 | 2 | 108 |
| 17 | Lawyer Milloy | 1996 | 2010 | 2-36 | TOT | NFL | 234 | 213 | 25 | 205 | 1 | 48 | 15 | 4 | 1 | 107 |
| 18 | Ken Houston* | 1970 | 1980 | 9-214 | TOT | NFL | 154 | 146 | 36 | 500 | 4 | 0 | 11 | 10 | 2 | 104 |
| 19 | Carnell Lake | 1989 | 2001 | 2-34 | TOT | NFL | 185 | 171 | 16 | 161 | 3 | 1 | 12 | 5 | 1 | 104 |
| 20 | Roger Wehrli* | 1970 | 1982 | 1-19 | CRD | NFL | 180 | 163 | 37 | 265 | 2 | 0 | 13 | 7 | 3 | 104 |
| 21 | Gary Fencik | 1976 | 1987 | 10-281 | CHI | NFL | 164 | 140 | 38 | 488 | 1 | 0 | 12 | 2 | 1 | 101 |
| 22 | Steve Atwater | 1989 | 1999 | 1-20 | TOT | NFL | 167 | 166 | 24 | 408 | 1 | 0 | 11 | 8 | 2 | 99 |
| 23 | Dave Brown | 1975 | 1989 | 1-26 | TOT | NFL | 216 | 203 | 62 | 698 | 5 | 0 | 15 | 1 | 0 | 99 |
| 24 | Jake Scott | 1970 | 1978 | 7-159 | TOT | NFL | 126 | 126 | 49 | 551 | 0 | 0 | 9 | 5 | 2 | 98 |
| 25 | Dennis Smith | 1981 | 1994 | 1-15 | DEN | NFL | 184 | 170 | 30 | 431 | 0 | 0 | 14 | 6 | 0 | 98 |
There's Fencik at #21. But do all the names belong on this list? For one thing, Seth Joyner is listed, and, as we all know, he was a linebacker (who, for some reason, PFR has listed as playing part-time as a strong safety in 1995 for Arizona), so he's out, and that moves Fencik up to #20. And then there is a pretty sizeable handful of guys who played the majority of their careers at cornerback and switched over to safety as their speed declined at the end. That was certainly the case for guys like Charles Woodson (#3), Ronde Barber (#4), Aeneas WIlliams (#7), Troy Vincent (#12), Albert Lewis (#16) and Roger Wehrli (#20), so excluding those guys moves Fencik up to 14th. Then there are a number of other players who started out as corners, but played a significant part of their careers at corner. Rod Woodson (#1, hallowed be his name) played 12 seasons as a cornerback, but then another five as a safety, and Ronnie Lott (#2) played only five seasons at corner before moving to the safety position he dominated for the next nine seasons. I'm making a subjective call here, but I'm calling Rod a cornerback and Lott a safety based on the arbitrary idea that Lott played more than half his career at the position and Rod did not. That leaves us, in terms of pure AV, with Fencik as the 13th-best post-merger safety. Here's the updated list:
1. Ronnie Lott (161)
2. Brian Dawkins (140)
3. Ed Reed (136)
4. Eugene Robinson (126)
5. Donnie Shell (120)
6. John Lynch (118)
6. Darren Sharper (118)
8. Troy Polamalu (115)
9. LeRoy Butler (111)
10. Lawyer Milloy (107)
11. Ken Houston (104)
11. Carnell Lake (104)
13. Gary Fencik (101)
But my gut is that Fencik was even better than that. In his first year as a starter (1977) the Bears were 17th in passing defense in terms of Adjusted Net Yards Per Pass Attempt (ANY/A). Between then and Fencik's retirement in 1987, they would only finish that low one other time, 17th again in strike-shortened 1982. For the other 9 seasons, they ranked 12th or higher, including five times in the top 6 and twice leading the league. Fencik was the key player and leader of those excellent secondaries, and the only player that was constant from the good Bears defenses of the late-70s through the mind-bogglingly dominant defenses of the mid-80s.
For my money, that sounds a lot better than, say, Carnell Lake - a very good player that was helped by playing on some very good defenses - or Lawyer Milloy - a player I always perceived as solid but not spectacular. The big difference between those guys and Fencik is that Fencik was hidden away for most of his career on pretty bad teams with good defenses that he led. Looking at that list, my gut tells me that Ronnie Lott, Ed Reed, Troy Polamalu, and Ken Houston are the elite of the elite - the sure-fire Hall-of-Famers (you have to think that both Reed and Polamalu will go in first-ballot). Brian Dawkins, Eugene Robinson, Donnie Shell, Darren Sharper - they feel to me a notch below that. If Lott, Reed, Polamalu, and Houston are the "elites," let's call these guys the "greats." They’re not quite Hall-of-Fame caliber, but almost. And that's the group I think Fencik belongs to. The others – Lynch, Butler, Milloy, Lake – they’re one more step down, to my mind. We can call them the “very goods” or some such. Fencik, I feel, is better than them.
I realize that I’m putting a lot of faith in my own instincts here, and it’s all awfully ambiguous, but I think I may be able to demonstrate it numerically. One thing I think AV is very good at is evaluating units within teams – if the defense was ranked, say, 5th in the league, well how much of that was owing to the defensive line, linebackers, secondary? This was the very question that Doug Drinen wanted to answer when he invented approximate value. He made two simple assumptions: first, success against the run was likely best credited to a combination of the defensive line and linebackers, and second, success against the pass was down to the defensive line and secondary. Clearly, math follows from those assumptions, but we’re not here to talk about math. We’re here to talk about Gary Fencik. In how many of his twelve seasons, all of them with the Bears, did he lead his secondary in AV? How about the same question applied to the others on the list?
What follows is a list of post-merger NFL safeties, sorted by the number of times they led their secondaries in AV. I don’t suggest this is a list of the best safeties of all-time, but I do suggest it as an alternative for fans to evaluate their favorite players at the safety position:
1.(1) Ronnie Lott - 9/14
1.(3) Ed Reed - 9/12
3.(8) Troy Polamalu - 8/12
4.(7) Darren Sharper - 7/14
4.(11) Ken Houston - 7/14
6.(5) Donnie Shell - 6.5/14
7.(2) Brian Dawkins - 5/16
7.(4) Eugene Robinson - 5/16
7.(13) Gary Fencik - 5/12
10.(9) LeRoy Butler - 4.5/12
11.(12) Carnell Lake - 4/12
12.(7) John Lynch - 3.5/15
13.(10) Lawyer Milloy - 2/15
That list has Gary Fencik tied for 7th among safeties, which jives with the way I felt about him. And yet I feel yucky. I started this article with a particular way I wanted to present a player to you, and I manipulated the statistical evidence until it said the thing that I wanted to say. I’ll reiterate what I said before: I think Gary Fencik is not-quite-a-Hall-of-Famer, a lot better than where NFL memory has left him. That’s my opinion, and I invite you to formulate your own. He’s a big executive at some investment bank in Chicago now, so I doubt he cares as he counts his millions.
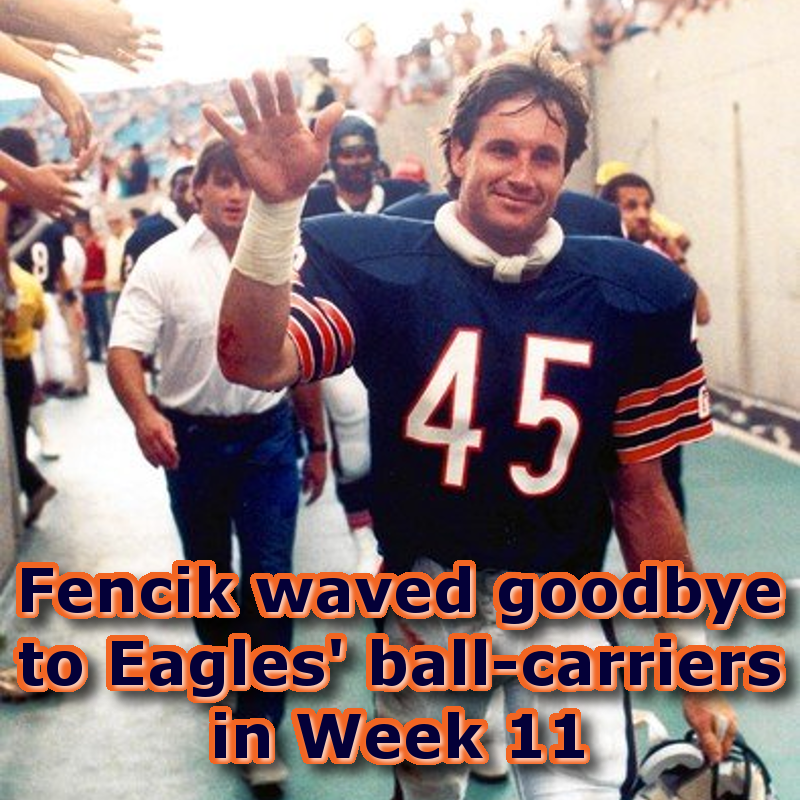
It didn’t take millions of points for Fencik and the Bears to take care of the Philadelphia Eagles in Week 11. In fact, it took just 14, which was just enough, as the Chicago defense held the Eagles to just 10. Gary Fencik was a big part of the reason why. He stalked the Philly offense, racking up 9 tackles and forcing two fumbles on the way to a big upset win.
df 2.6.2016
Passing Leaders
| NAME | COMP | YRDS | |
|---|---|---|---|
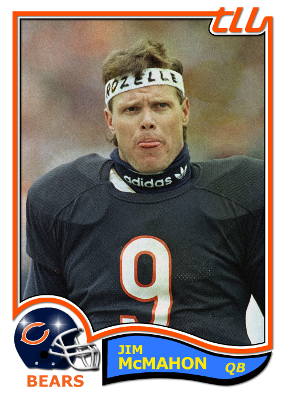 | Jim McMahon | 89 | 2170 |
| Vince Evans | 6 | 178 |
View Complete Stats
Rushing Leaders
| NAME | ATT | YRDS | |
|---|---|---|---|
 | Walter Payton | 83 | 549 |
| Rickey Watts | 71 | 434 | |
| Jim McMahon | 5 | 4 | |
| Roland Harper | 0 | 0 | |
| Brian Baschnagel | 0 | 0 |
View Complete Stats
Recieving Leaders
| NAME | REC | YRDS | |
|---|---|---|---|
 | Walter Payton | 31 | 1075 |
| Matt Suhey | 20 | 630 | |
| Ken Margerum | 24 | 385 | |
| Emery Moorehead | 15 | 250 | |
| Rickey Watts | 5 | 10 |
View Complete Stats
Tackle Leaders
Interception Leaders
Sack Leaders
| OFFENSE | DEFENSE | SPECIAL TEAMS |
|---|---|---|
| Passing | Tackles | XP/FG |
| Rushing | Sacks | Punting |
| Recieving | Interceptions | Kick Returns |
| Scrimmage Yards | Forced Fumbles | Punt Returns |
| Scoring | Touchdowns | Scoring |
| Name | # | Age | RS | RP | MS | HP | BB | AG | PS | PC | PA | AR | CO |
|---|---|---|---|---|---|---|---|---|---|---|---|---|---|
| Jim McMahon | 9 | 23 | 69 | 25 | 19 | 13 | 31 | 44 | 44 | 50 | 56 | 31 | 44 |
| Vince Evans | 8 | 27 | 69 | 25 | 13 | 25 | 19 | 25 | 69 | 38 | 38 | 44 | 38 |
| Name | # | Age | RS | RP | MS | HP | BB | AG | BC | RE |
|---|---|---|---|---|---|---|---|---|---|---|
| Rickey Watts | 80 | 25 | 69 | 25 | 56 | 19 | 38 | 38 | 56 | 38 |
| Walter Payton | 34 | 28 | 69 | 38 | 56 | 44 | 56 | 69 | 69 | 56 |
| Willie McClendon | 37 | 25 | 69 | 38 | 31 | 25 | 19 | 38 | 56 | 19 |
| Roland Harper | 35 | 29 | 69 | 31 | 25 | 44 | 13 | 38 | 63 | 19 |
| Name | # | Age | RS | RP | MS | HP | BB | AG | BC | RE |
|---|---|---|---|---|---|---|---|---|---|---|
| Ken Margerum | 89 | 24 | 69 | 31 | 44 | 13 | 25 | 56 | 63 | 44 |
| Matt Suhey | 26 | 24 | 69 | 38 | 25 | 56 | 31 | 44 | 69 | 50 |
| Brian Baschnagel | 84 | 28 | 69 | 31 | 44 | 13 | 31 | 44 | 63 | 44 |
| James Scott | 89 | 30 | 69 | 25 | 44 | 13 | 25 | 56 | 63 | 31 |
| Name | # | Age | RS | RP | MS | HP | BB | AG | BC | RE |
|---|---|---|---|---|---|---|---|---|---|---|
| Emery Moorehead | 87 | 28 | 69 | 25 | 38 | 44 | 25 | 44 | 63 | 44 |
| Robin Earl | 81 | 27 | 69 | 19 | 31 | 50 | 13 | 19 | 56 | 25 |
| Name | # | Age | RS | RP | MS | HP | BB | AG |
|---|---|---|---|---|---|---|---|---|
| Keith VanHorne | 78 | 25 | 69 | 44 | 31 | 44 | 31 | 25 |
| Dan Neal | 52 | 33 | 69 | 25 | 31 | 56 | 25 | 19 |
| Noah Jackson | 65 | 31 | 69 | 19 | 25 | 50 | 13 | 13 |
| Jeff Williams | 74 | 27 | 69 | 25 | 19 | 44 | 13 | 19 |
| Phil McKinnely | 67 | 28 | 69 | 31 | 25 | 44 | 13 | 38 |
| Name | # | Age | RS | RP | MS | HP | BB | AG | INT | QU |
|---|---|---|---|---|---|---|---|---|---|---|
| Mike Hartenstine | 73 | 29 | 44 | 44 | 44 | 56 | 13 | 50 | 6 | 56 |
| Jim Osborne | 68 | 33 | 50 | 38 | 50 | 56 | 13 | 50 | 6 | 56 |
| Dan Hampton | 99 | 25 | 50 | 50 | 63 | 69 | 13 | 19 | 6 | 81 |
| Al Harris | 90 | 25 | 44 | 44 | 44 | 50 | 13 | 50 | 6 | 50 |
| Steve McMichael | 76 | 25 | 31 | 44 | 31 | 44 | 13 | 63 | 6 | 31 |
| Henry Waechter | 75 | 23 | 25 | 38 | 19 | 38 | 13 | 13 | 6 | 25 |
| Name | # | Age | RS | RP | MS | HP | BB | AG | INT | QU |
|---|---|---|---|---|---|---|---|---|---|---|
| Otis Wilson | 55 | 25 | 50 | 44 | 44 | 56 | 19 | 63 | 25 | 69 |
| Mike Singletary | 50 | 24 | 38 | 38 | 44 | 69 | 19 | 6 | 19 | 56 |
| Gary Campbell | 59 | 30 | 56 | 38 | 50 | 44 | 31 | 38 | 13 | 56 |
| Brian Cabral | 54 | 26 | 31 | 38 | 19 | 44 | 19 | 25 | 13 | 31 |
| Bruce Huther | 57 | 28 | 31 | 31 | 31 | 38 | 13 | 19 | 13 | 25 |
| Name | # | Age | RS | RP | MS | HP | BB | AG | INT | QU |
|---|---|---|---|---|---|---|---|---|---|---|
| Terry Schmidt | 44 | 30 | 50 | 44 | 50 | 13 | 44 | 63 | 63 | 75 |
| Leslie Frazier | 21 | 23 | 44 | 44 | 38 | 13 | 44 | 63 | 50 | 56 |
| Reuben Henderson | 22 | 24 | 50 | 38 | 44 | 13 | 44 | 56 | 38 | 44 |
| Kevin Potter | 20 | 23 | 44 | 31 | 38 | 13 | 44 | 44 | 25 | 31 |
| Gary Fencik | 45 | 28 | 63 | 44 | 56 | 56 | 25 | 44 | 50 | 75 |
| Len Walterscheid | 23 | 28 | 38 | 38 | 44 | 44 | 25 | 31 | 31 | 44 |
| Todd Bell | 25 | 24 | 25 | 31 | 38 | 50 | 25 | 44 | 31 | 38 |
| Name | # | Age | RS | RP | MS | HP | BB | AG | KP | AB | AC |
|---|---|---|---|---|---|---|---|---|---|---|---|
| John Roveto | 4 | 24 | 81 | 56 | 81 | 31 | 13 | 38 | 38 | 50 | 50 |
| Name | # | Age | RS | RP | MS | HP | BB | AG | KP | AB |
|---|---|---|---|---|---|---|---|---|---|---|
| Bob Parsons | 86 | 32 | 81 | 25 | 44 | 31 | 13 | 38 | 56 | 69 |
Additional Practice Squad Players
--------------------No Players---------------------
10 - 6 - 0
8th
3 - 3 - 0
28th
7 - 3 - 0
27th
146.75 Yds/Game
4th
60.88 Yds/Game
26th
207.63 Yds/Game
8th
102.50 Yds/Game
1st
67.25 Yds/Game
8th
169.75 Yds/Game
1st
| Name | Year |
|---|
| Name | Year |
|---|
| Name | Year |
|---|
| Name | Year |
|---|
| Name | Year |
|---|
| Name | How Many |
|---|
Walter Payton was a great man and a great rusher and a great friend. It's nice to see you guys giving him his due respect. I look forward to watching your games with me in them when you get there.
Walter Payton was a great man and a great rusher and a great friend. It's nice to see you guys giving him his due respect. I look forward to watching your games with me in them when you get there.
Walter Payton was a great man and a great rusher and a great friend. It's nice to see you guys giving him his due respect. I look forward to watching your games with me in them when you get there.